sad charts – thru 5/16/5

Quick analysis:
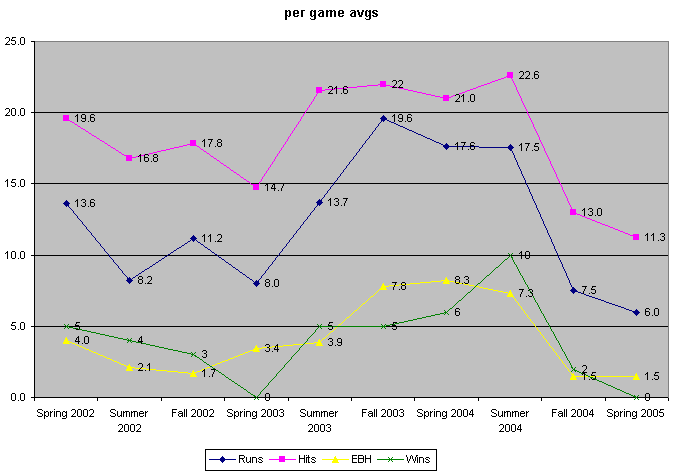
Fewer H + fewer EBH + fewer R = fewer W.
It looks like Hits are better correlated with Runs than EBH are.

Quick analysis:
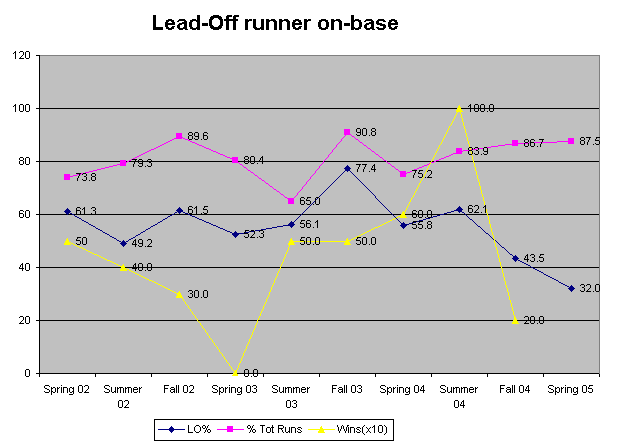
We score most of our runs (80+% of total R) when the lead-off runner gets on-base, which we’re doing less and less often.

Quick analysis:
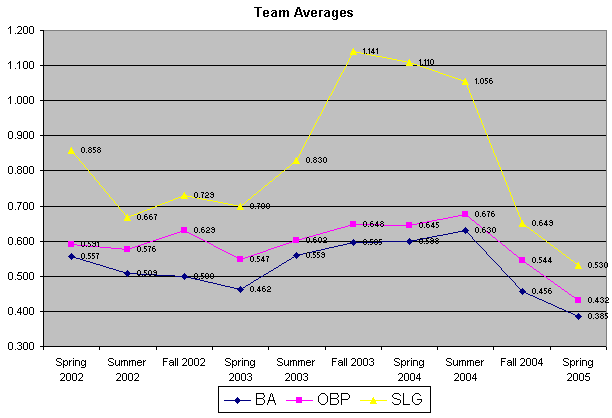
This Spring we’re down .291 from our high AVG (Summer 04)
We’re down .176 from our 3-year AVG (.552)
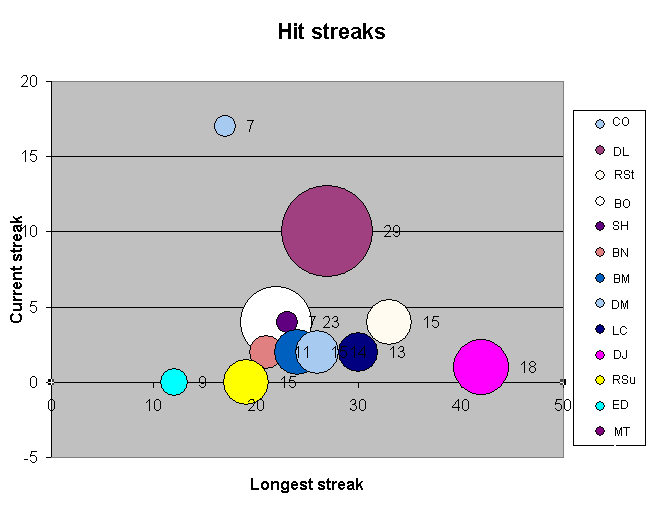
Grove is fun for power hitters.

| Craig | Danny | Rich | Bobby | Sean | Bob | Brain | Doug | Loren |  DJ  | Robo |  Ed  | MT |
|---|
Current | 17 | 10 | 4 | 4 | 4 | 2 | 2 | 2 | 2 | 1 | 0 | 0 | 0 |
|---|
Longest | 17 | 27 | 33 | 22 | 23 | 21 | 24 | 26 | 30 | 42 | 19 | 12 | 7 |
|---|
3+ hits | 7 | 29 | 15 | 23 | 7 | 11 | 15 | 14 | 13 | 18 | 15 | 9 | 0 |
|---|
1.000 | 6 | 10 | 7 | 10 | 6 | 8 | 4 | 7 | 9 | 10 | 8 | 6 | 0 |
|---|


